As a trader, you will find candlestick patterns extremely useful because they provide you with great visual cues, so you can interpret market sentiment and predict price movements. And if you are a beginner trader, you might have the misconception that you can use candlestick patterns only for stock trading, but the truth is that you can apply them for the majority of assets in your portfolio. Are you dabbling in commodities, crypto, or forex? Then you will gain some valuable insights from using them.
This article is meant to provide you with knowledge about the kind of assets you can trade using candlestick patterns, so let’s dive in and explore the diversity of opportunities you can benefit from.
Table of Contents
Stocks are the classic playground

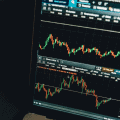
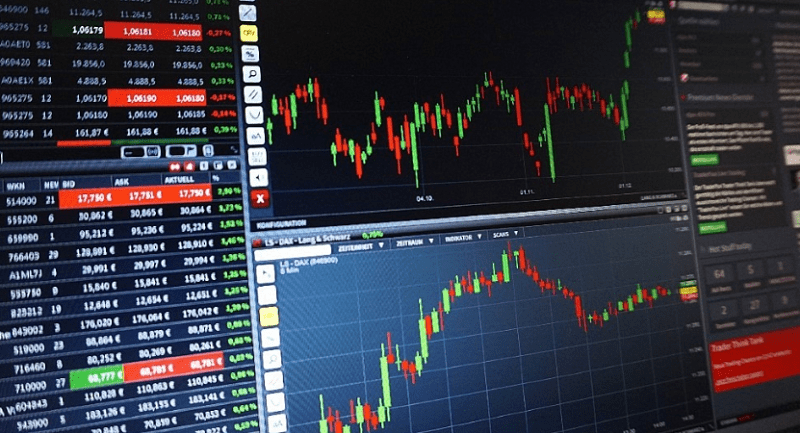
As mentioned earlier, the majority of people associate candlestick patterns with stocks, and there is a good reason behind this, they have been a staple in the sector for years and helped investors create strategies based on price movements. Suppose you want to trade stocks and are interested in a tech firm like Apple, you can use patterns like the “Doji,” “Hammer,” or “Engulfing” to track potential reversals or continuations in price trends.
Imagine you’re watching the stock of a company like Tesla. After a prolonged uptrend, you spot a “Shooting Star” pattern—a single candle with a small body and a long upper wick. This might suggest that the bulls are losing momentum, and a price drop could be on the horizon. Similarly, a “Morning Star” pattern appearing after a downtrend might indicate that it’s time to consider buying, as the market sentiment could be shifting towards optimism.
In Forex you can easily navigate currency pairs
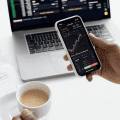
The foreign exchange market is also quite popular among investors, and a domain where you can use candlestick patterns. You need all the tools you have access to when trading forex assets because you enter one of the most liquid and fast-paced markets in the works, so you must make quick but informed decisions. Currency pairs like EUR/USD, GBP/JPY, and USD/CHF often exhibit clear candlestick patterns that can guide traders through volatile price movements.
For example, if you’re trading the EUR/USD pair and notice a “Bearish Engulfing” pattern forming on the chart, it could be a sign that the euro is losing strength against the dollar, prompting you to consider a short position. Conversely, a “Bullish Harami” pattern might suggest that a downtrend is losing steam, signaling a potential buying opportunity. Regardless of your time frame you can use candlestick patterns because they work well in any scenario.
Gain insights into the crypto digital wave
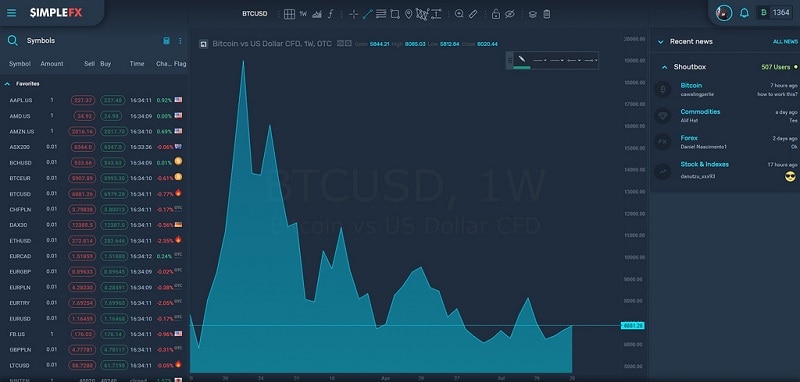
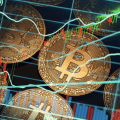
You must have slept under a rock if you haven’t heard about cryptocurrencies. And as expected, traders have brought candlestick patterns into the sector to help them navigate one of the most volatile markets. Regardless of the type of crypto you want to add to your portfolio, a well-known asset like Bitcoin or Ethereum, or a lesser-known one like Toncoin, you can use candlestick patterns to figure out what the best way to trade them is.
Digital currencies are notorious for their rapid price swings, making technical analysis tools like candlestick patterns even more valuable. For instance, spotting a “Hammer” pattern after a sharp decline in Bitcoin’s price might suggest that the market is finding support, and a rebound could be on the way. On the flip side, a “Dark Cloud Cover” pattern during a rally could indicate that selling pressure is increasing, and it might be time to take profits. Moreover, because crypto markets operate 24/7, you can find patterns at any time of day or night, providing continuous opportunities to make informed trading decisions.
Expand your knowledge by trading commodities
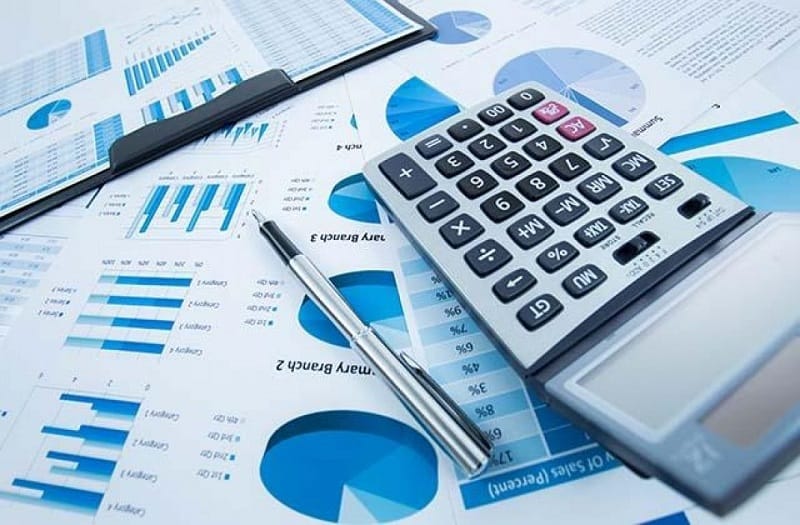
By this point, you already expect that candlestick patterns aren’t limited to stock and currencies trading, but can also be used for other assets like commodities. Regardless if you want to add precious metals like silver and gold, agricultural products like corn and wheat, or energy resources like natural gas and oil to your portfolio, you can benefit from candlestick charts to track price movements.
Take gold, for example. If you notice a “Bullish Engulfing” pattern after a period of declining prices, it might suggest that buyers are stepping in, potentially pushing prices higher. Similarly, in the oil market, a “Doji” appearing after a strong uptrend could indicate indecision among traders, hinting at a possible reversal.
Geopolitical events, economic data, and supply-demand dynamics, often influence commodities markets which can lead to sudden price changes. Candlestick patterns help traders interpret these movements and adjust their strategies accordingly.
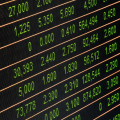
Use indices to analyze the market sentiment on a broader scale
You might one to move a step forward and trade broader market trends instead of individual assets. In this case you can also apply candlestick patterns to indices like the S&P 500, NASDAQ, or Dow Jones Industrial Average. Indices represent a basket of stocks, providing a snapshot of overall market performance, and candlestick charts can help you gauge the prevailing sentiment. For instance, if the S&P 500 shows a “Three White Soldiers” pattern—three consecutive bullish candles with higher closes—it could signal strong market confidence and the potential for continued upward momentum. Conversely, a “Gravestone Doji” appearing on the NASDAQ might suggest that the recent rally is losing steam, and a pullback could be imminent.
When you trade indices and use this tool you can capitalize on broader market movements without dealing with individual assets. It’s one of the most interesting diversifying strategies, so why not use it?
Candlestick patterns look quite versatile
As you can see, candlestick patterns are incredibly versatile and can be applied to a wide range of assets, from stocks and forex to cryptocurrencies, commodities, indices, bonds, and ETFs. Regardless of the market you’re trading, these patterns offer valuable insights into price movements, market sentiment, and potential reversals, making them essential tools for any trader’s arsenal.
Whether you’re a seasoned trader or just starting, learning to recognize and interpret candlestick patterns can significantly enhance your trading strategy. By combining these patterns with other technical and fundamental analysis tools, you’ll be better equipped to navigate the complexities of the financial markets and make more confident, informed decisions.
Wait! Before You Go, Read:
 The Biggest Benefits of CFD Trading
 Nueva Wealth Reviews 2025: How Are Traders Making It Work?
 Key Factors That Affect Forex Liquidity and Market Stability
 11 Trading Strategies You Should Consider for Success
 How to Compare Forex Brokers: Key Features to Consider
 Could Bull360 Be One of 2026’s Most Underrated Platforms?
 Why This Reversal Signal Gets Traders Excited
Prop Firm Trading and Taxation: What You Need to Know
Why This Reversal Signal Gets Traders Excited
Prop Firm Trading and Taxation: What You Need to Know
 Trading Tips For Beginners
 11 Trading Tips and Tricks for Mastering the Market
 10 Best Prop Trading Firms for Aspiring Traders
 How to Use Advanced Trading Platforms for Prop Firm Trading
 The Canadian Trader’s Edge: Why Many Brokers Accept Canadians and Allow Crypto Trading
 How Real-Time Data Can Help You With Better Trading Decisions
 Why Speed is the Most Underrated Advantage in Today’s Stock Market?
 How To Use A Trading Chatroom As Investors
 Which Trading Platforms Are Best for Beginners Joining Prop Firms?
 Forex Risk. How to Calculate Your Returns
 Is Funding the Right Strategy for Your Trading Journey?
Making Money from Social Trading – Here’s How to Get Started
A New Name in Online Trading Under the Microscope
Is Funding the Right Strategy for Your Trading Journey?
Making Money from Social Trading – Here’s How to Get Started
A New Name in Online Trading Under the Microscope
 Discover the Next Big MemeCoin Trading Phenomenon
 How to Pick the Perfect Prop Firm Challenge to Level Up Your Trading
 New-Age Investing: Tools That Work While You Sleep
 The Impact Of A Covid-19 Vaccine On The Financial Markets