Understanding user behavior is at the core of creating exceptional digital experiences. As web developers, UX designers, or digital marketers, you’re constantly seeking ways to understand how users interact with your website, app, or platform. This is where UX signals come into play.
But what exactly are UX signals, and why are they so crucial for crafting user-friendly designs and strategies? This blog breaks it all down, unpacking the essentials of UX signals, their key types, and how to leverage them to improve user engagement and satisfaction.
Table of Contents
What Are UX Signals?
UX signals—short for user experience signals—refer to measurable data points and behaviors that shed light on how users interact with digital interfaces. These signals help indicate whether users are enjoying their experience or facing obstacles. They provide insight into areas that need improvement and reveal the elements that work well.
Think of UX signals as breadcrumbs that users leave while navigating your site or application. They tell a story about their satisfaction level, intent, frustrations, or moments of delight.
Common examples of UX signals include:
- Session duration
- Click-through rates (CTR)
- Task success rates
- Bounce rates and exit rates
- Heatmap activity
- Time to first click
These signals don’t just quantify user interaction; they serve as key performance indicators (KPIs) to inform product development and marketing strategies.
Why Do UX Signals Matter?
UX signals are not just numbers on a screen; they tell a deeper story about how your audience feels and behaves. Here’s why they matter:
1. They Help Optimize User Journeys
UX signals highlight bottlenecks and inefficiencies in user flows. For example, a high exit rate during the checkout process signals a problem requiring immediate attention, such as poor form design or unexpected shipping costs.
2. They Enhance Decision-Making
Leveraging data-driven insights ensures that improvements to your site or app are not guesswork. UX signals provide tangible evidence of what works and what doesn’t, enabling teams to make better decisions.
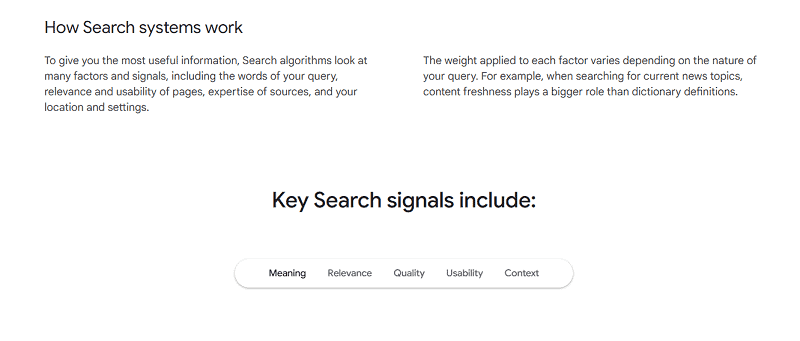
3. UX Signals Impact SEO
Search engines like Google prioritize websites that deliver high-quality user experiences. Certain UX signals, such as bounce rate and session time, are considered indicators of relevancy and quality, which contribute to your site’s ranking.
4. They Drive Revenue
Positive UX signals are often directly correlated to better business outcomes. A seamless, user-friendly design can boost conversions, improve customer retention, and increase overall satisfaction metrics.
Types of UX Signals and How to Measure Them
To effectively track UX signals, it’s essential to focus on the right metrics. Here’s a breakdown of key types of UX signals and how to measure them:
1. Engagement Metrics
Engagement metrics reveal how users interact with your content. Some key engagement-related UX signals include:
- Session Duration: The average time users spend on your site. A longer session indicates higher engagement.
- Pages Per Session: The number of pages a user visits per session. Pages per session provide insight into how compelling and intuitive your site structure is.
How to measure:
Use tools like Google Analytics or Hotjar to track session duration and navigation patterns.
2. Behavioral Metrics
Behavioral metrics track specific interactions with your interface:
- Click-Through Rate (CTR): This measures the percentage of users who click a specific element, such as a call-to-action (CTA) button or a menu item.
- Scroll Depth: Indicates how far users scroll on a webpage, highlighting content visibility and interest areas.
How to measure:
Utilize tools like Crazy Egg for heatmaps or Mixpanel for event tracking.
3. Conversion Metrics
Conversion metrics focus on whether users complete desired actions:
- Task Success Rate: Measures how often users are able to complete specific tasks (e.g., submitting a form or completing a purchase).
- Goal Completion Rate: Tied to larger objectives like signing up for a newsletter or downloading a resource.
How to measure:
Link Google Analytics goals with your website or use tools like Optimizely for A/B testing.
4. Drop-Off Metrics
Drop-off metrics indicate areas where users disengage or abandon a task:
- Bounce Rate: Tracks the percentage of users who leave a webpage without interacting further.
- Exit Rates: Reveal where users leave most frequently.
How to measure:
Google Analytics provides insights into both bounce and exit rates, helping to locate problem areas.
5. Perceptual Metrics
These metrics go beyond numbers by analyzing users’ subjective feelings:
- User Feedback: Collected through post-session surveys or usability testing.
- Net Promoter Score (NPS): Gauges the likelihood of users recommending your product or service.
How to measure:
Conduct surveys with Typeform or include feedback widgets like Qualtrics on your site.
How to Use UX Signals to Improve Your Platform
Once you’ve collected UX signals, the next step is turning the data into actionable insights. Here’s how:
1. Analyze the Funnel
Pinpoint where users drop off in the funnel. For instance, if exit rates spike at cart pages, investigate factors like unclear pricing, mandatory sign-ups, or long forms. Often, small fixes like simplifying buttons or removing unnecessary fields can lead to big gains.
2. Improve Page Load Times
Long page load times are a primary driver of high bounce rates. Test your platform using tools like Google PageSpeed Insights, and optimize images, scripts, and server response times.
3. Prioritize Mobile Optimization
With mobile usage growing, poor mobile experiences often cause a dramatic rise in bounce rates. Tools like BrowserStack can help you test and refine mobile interfaces.
4. Use Heatmaps for Visual Clarity
Heatmaps help you see where users focus their attention and where they lose interest. Use this data to eliminate distractions, reposition CTAs, and declutter your interface.
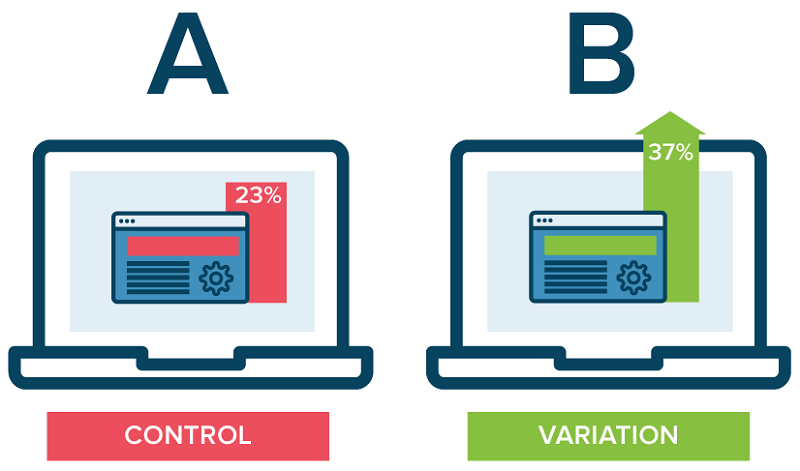
5. Tailor A/B Testing
Run A/B tests on key pages or tasks to compare user responses to different designs or systems. For example, try testing two variations of a subscription form to see which drives higher sign-ups.
6. Regularly Gather User Feedback
Allow your users to voice their frustrations or suggestions with in-app feedback modules or follow-up surveys. You can also recruit users for in-depth usability testing.
By continuously iterating based on feedback, you’re not just creating a website or app; you’re crafting a platform users truly love.
Final Thoughts on UX Signals
UX signals are invaluable tools that provide a window into user behavior, enabling you to refine your site’s design, functionality, and overall experience. By understanding and acting on these signals, you can create tailored digital experiences that boost satisfaction, engagement, and your bottom line.
Don’t overlook the impact of small, incremental improvements—each positively optimized signal contributes to a better user experience.
Want to take your UX mastery to the next level? Start by integrating these insights into your workflow today!
Wait! Before You Go, Read:
 ROI vs ROAS: What’s the Difference and Why Do They Matter?
 10 Ways to Reduce Bounce Rate on Your Blog
 Maximize Your Profit with the Help of These Conversion Rate Optimisation Tools
 7 SEO Metrics to Make Sure Your Search Campaigns Are Healthy
 Understanding How Web Design Affects SEO
 Best Practices of Internal Linking for SEO Benefits
 How to Implement AI for Content Recommendations in WordPress
 7 Actionable Ways to reduce Your Blog Bounce Rate
 Modern Web Implementation: Best Practices & Strategies
 What Metrics Should You Track to Evaluate Continuous Testing Effectiveness?
 How to Build an Onboarding Funnel?
 Top 6 Wix Integrations for Small Business Owners
 On-Page SEO: What You Need to Know to Optimize Your Web Pages
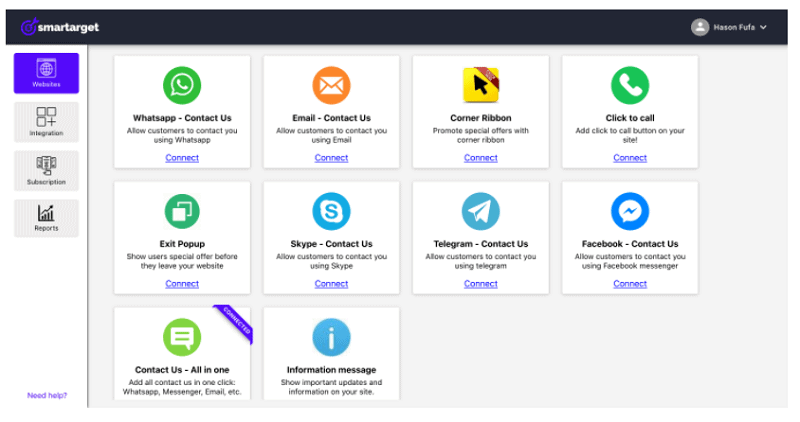 Smartarget: Improve User Engagement And Sales Without Coding
 Does Your Website Design Suck? 5 Reasons to Change It!
 How to Write for Users and Search Engines: 10 Practical Steps
 How to Create a Quality Content Strategy for a Mobile App?
 How to Use Finteza to Boost Your Website Conversions Analyzing Quality Traffic
 Turn Eyeballs Into Earnings with a Powerful Display Ad Network
 4 Tools to Quickly Increase Your Mailing List
 Digital Events: Which Metrics Should You Monitor?
 12 Tips to Optimize Your Conversion Rate
 How I Increased My Adsense CTR by 400% in 3 Weeks with Adngin
 9 Must Have Plugins for Your Blog